
The Lost Art of Debugging
It seems like debugging is a lost art. In this article we discuss how to debug and a simple method to follow that scale to allow debugging of large code bases.
So, you committed that code, and the testers find that random edge case that throws an unexplainable error or you get thrown into an unknown codebase to fix an issue. Now, for some software developers it is an easy task to debug the code and follow its execution until they figure out where the error is coming from. If that is you, please feel free to skip this article. I am not trying to insult anyone’s intelligence, just trying to talk through something that I see as an issue. Day in and day out I see a lack of this skill among junior to mid-level software developers. I am starting to lean towards either this is a skill that is not learned in university programs or not being effectively developed within teams. The development of skills within a team provides enough material for another discussion so I will do my best to stay on task.
I can’t count the number of times where I hear the phrase, “This code/endpoint is broken, figure out what is going on and get it fixed.” Where do you begin? How do you handle this situation? It is at this point that we will jump into hopefully a simple and easy to follow method for doing this. For the purposes of this talk I will use Java and IntelliJ. However, this process should roughly apply across multiple languages and IDEs, but I have had moments with older frameworks and code bases so where appropriate, I will try to explain methods to test what is going on. The code for this is located here. Feel free to pull it down and follow along.
Starting out, I like to get exactly what caused the error or bad behavior to start. In the case of a RESTful API, I get the HTTP method, the URL, and the Request Body that was used. This should allow me to reproduce the issue. I like to run the request and double check that Request Body is correct. Too many times, the issue is not due to the code but to the operator sending bad information. If you figure out the issue at this point, Great!!!
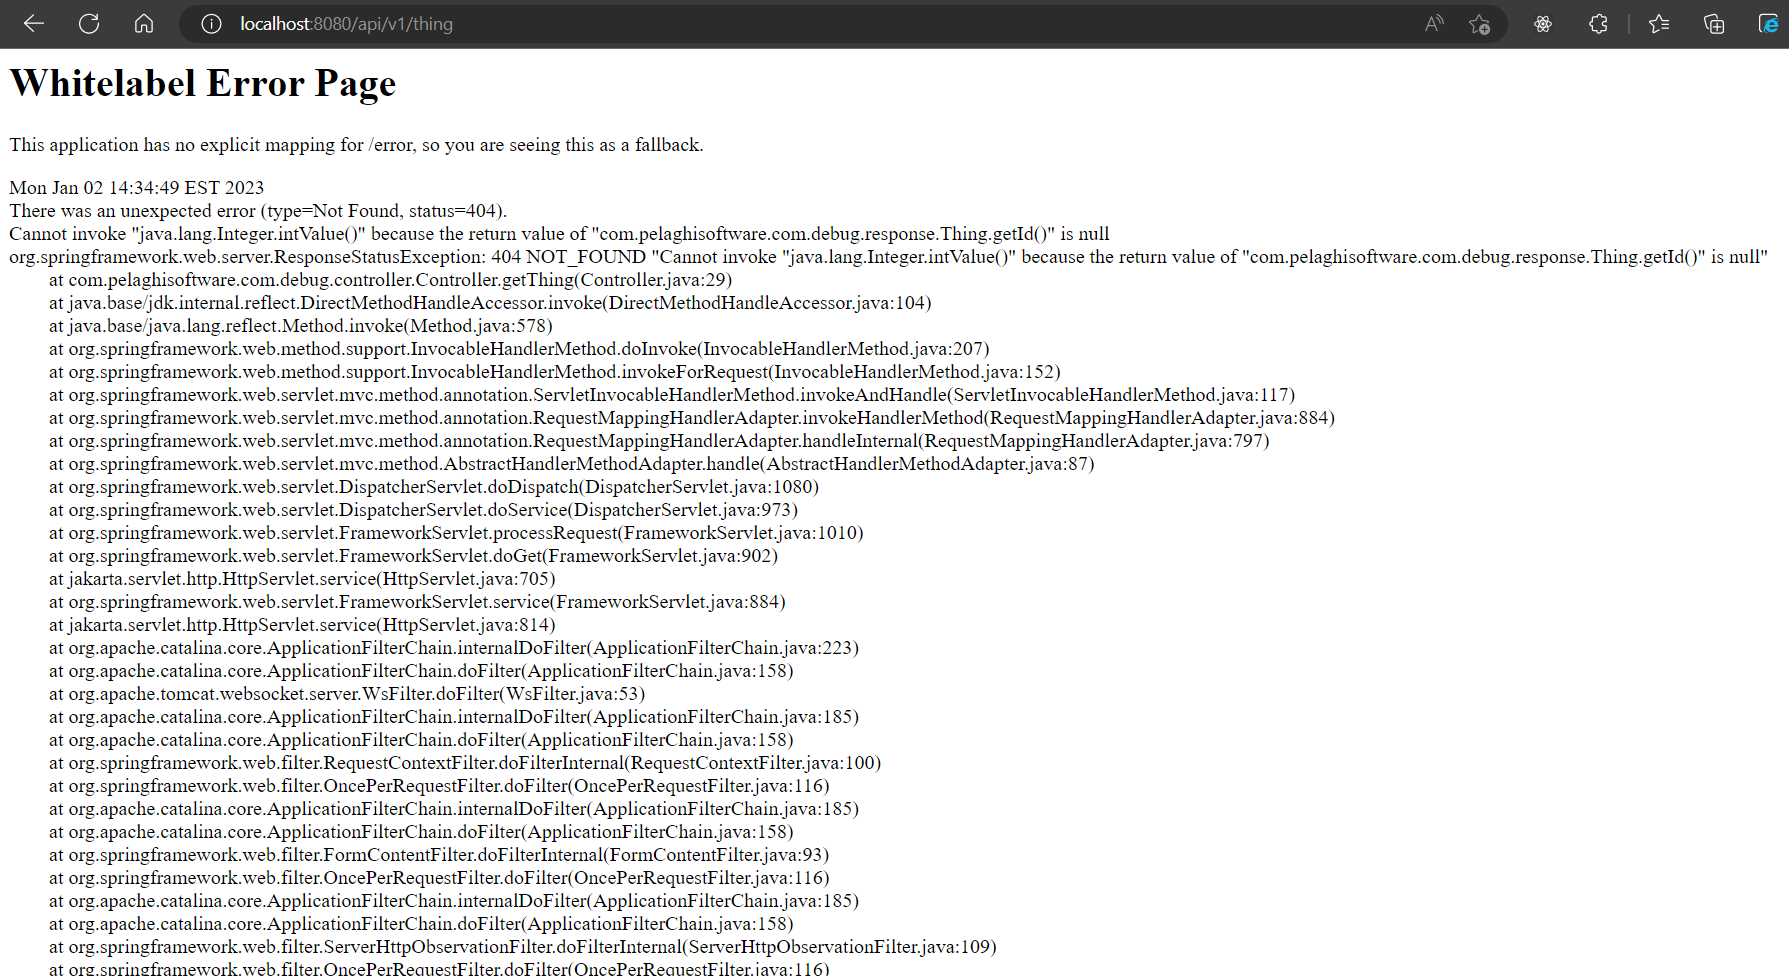
However, we will likely need to troubleshoot further. This is where I think a lot of developers get lost. This is where we need to break down the problem into smaller chunks. In our example we are receiving a 404 Status Code and an exception. In production, we would not have an exception page like this, but for the purposes of the talk we will focus on the debugging aspect only.
We notice that the code is written in a way that the error is coming from the Controller, but our controller looks like this:
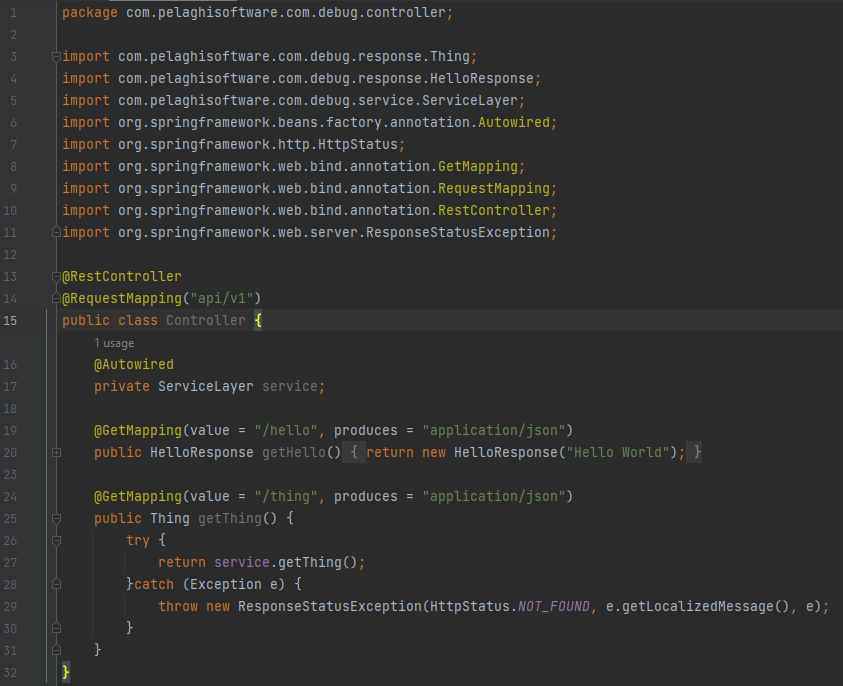
In other words, our controller is catching all exceptions and then rethrowing an exception so a 404-Not Found Status is returned. To make our debugging task easy, I follow the code in until I find places where the code would likely break. I place breakpoints at each line of code where errors could happen and then I just forward through the code until I find the offending line. So, in our example it would look something like the below.
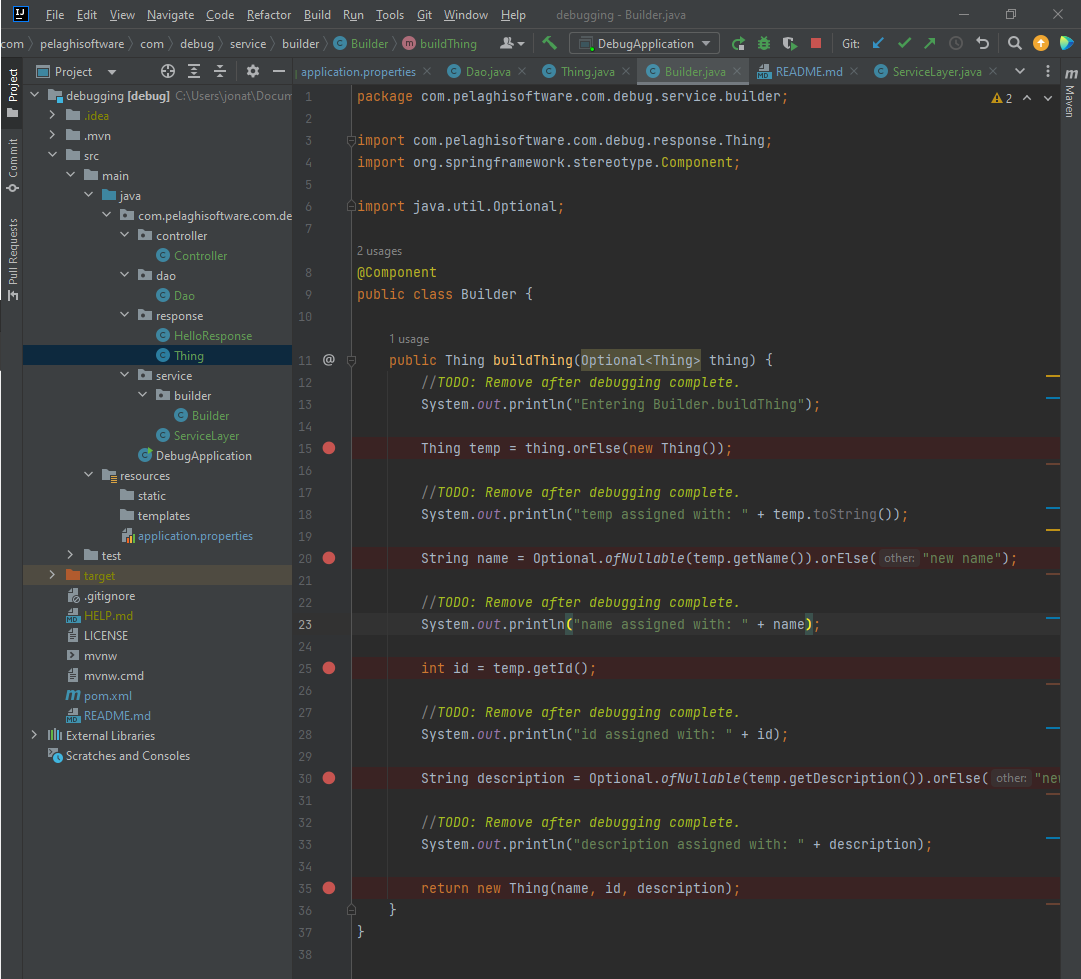
Each of the Red circles is showing a break point. When running in debug mode through the IDE, our code should stop on each of those lines. You may notice some print statements here. This is the case for when, your language or environment doesn't allow you the ability to debug from within your IDE. This allows me to follow the execution of the code after the fact. This would give us a way to see where the code is failing. Using the debugger, we see:
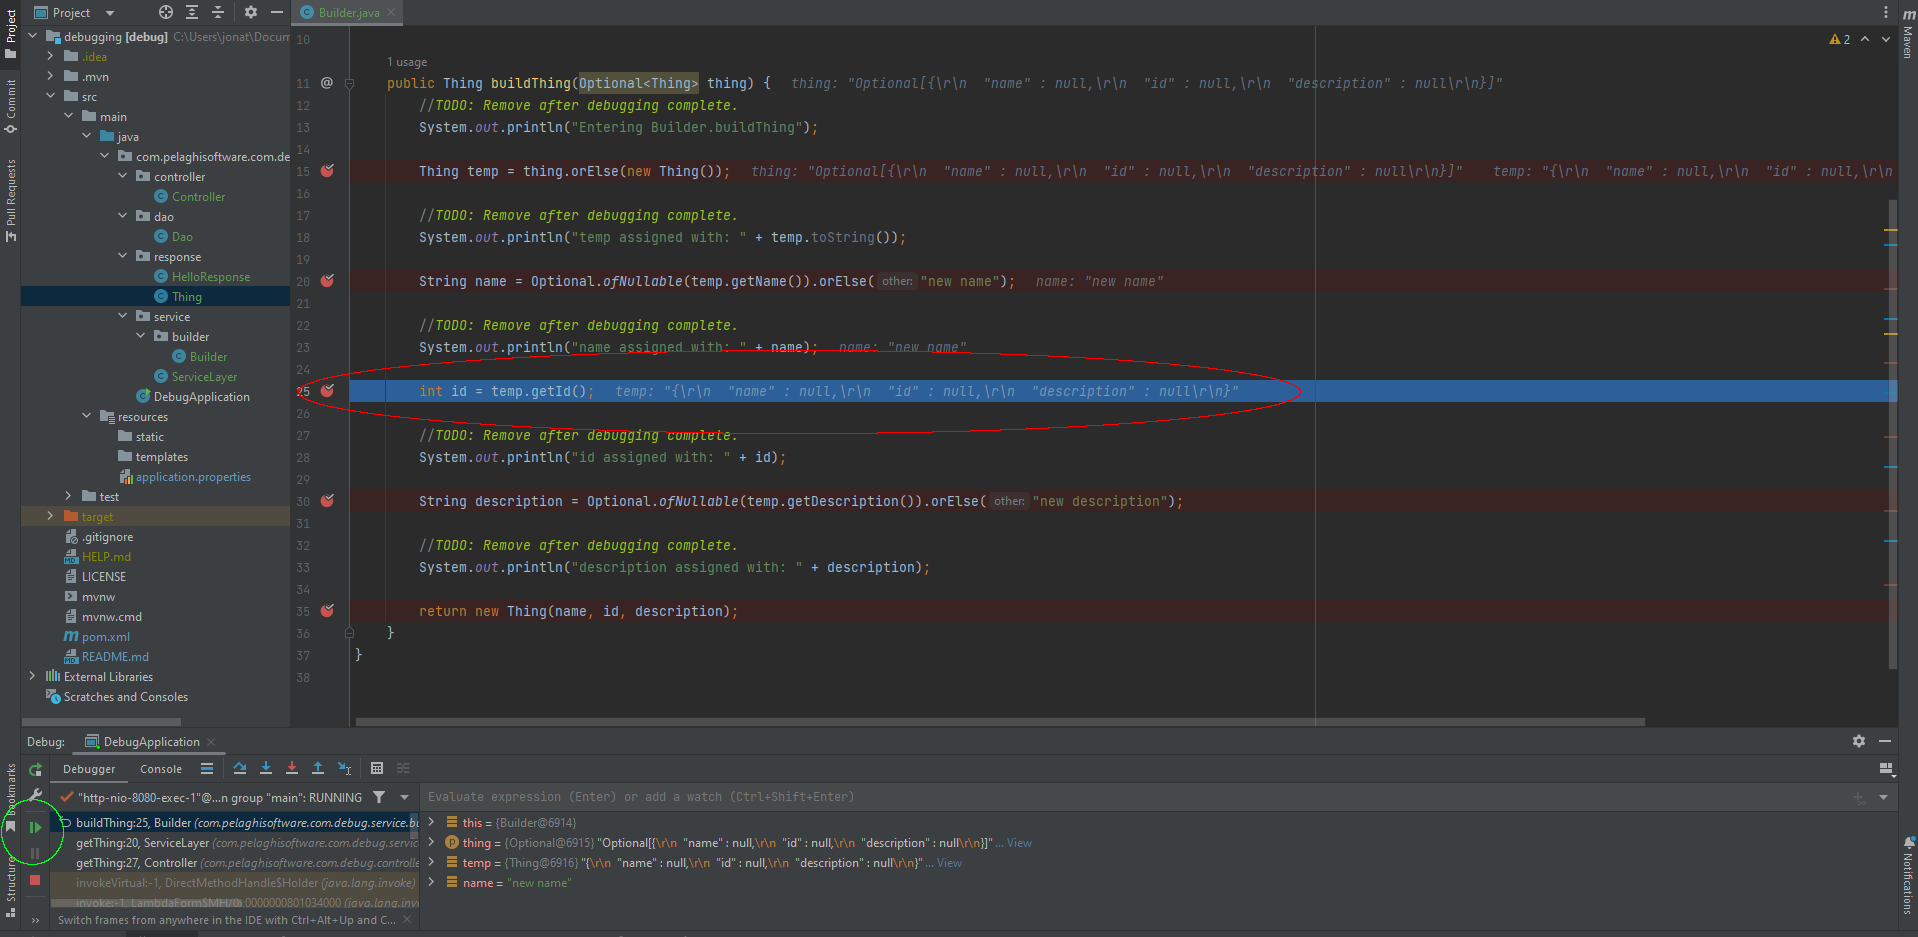
In red we see where we have stopped at the line. The first time through we will notice that the id is null. This could be our first clue given that we see Thing.getId() is null in the exception. When we click Resume Program (the button circled in green) we should see that we do not reach Line 30, our debugging stops, and the error is returned to our browser. Voila! We found our error. We can simply use an Integer instead of int on this line to prevent the unboxing of our value into a primitive and you should see that we get past that line at this point.
While this is an oversimplified version of debugging, it is essentially the same for 99% of debugging. Find the line where the exception or bad operation happens, then fix it. The method laid out above while simple, can be applied to most situations and scaled up for larger code bases.
I hope this helps someone along the way. If you have additional advice or any questions, please leave a comment down below. Until next time, have a good one and ci vediamo presto!